Bear market — directional engines are silent; carry and 4H momentum take over
Crypto signals that go quiet when there is nothing worth buying.
Five engines measured over six years, each validated against a random draw of the same density. When the market does not cooperate, the channel says so instead of inventing trades. Free on Telegram, no signup.
No human involvement, no opinions, no “analyst”. A program reads prices, applies rules fixed in advance, and publishes — or does not.
The market is ranked
Every day, 40 cryptos are compared against each other. The program is not looking for a secret pattern: it checks which ones are genuinely strongest right now.
The regime is checked
If Bitcoin closes below its 200-day average, the engines that buy strength stop. That happens 41% of the time, and it is what avoids the -70% years.
You get the signal
Entry, stop, three milestones, and the exit date. On Telegram, the moment it is detected. Every signal names the engine it came from.
The outcome is published
Win or lose, the signal is closed publicly on the channel and archived on this site. Nothing is removed afterwards.
Five signal engines, each validated against a random control: relative strength, channel breakout, volatility expansion, funding carry, and 4-hour momentum. The last two keep producing when the market falls. Updated daily.
Three families buy an uptrend: entry, a deliberately wide 4x ATR stop (disaster protection, not a management tool), tracking milestones at 4x, 8x and 12x ATR, and a time-based exit — the date closes the position, not a price target. The fourth one, the funding carry, does not bet on price at all: it opens two opposite legs and closes on a date. It therefore has no stop loss and no take profit, and that is normal.
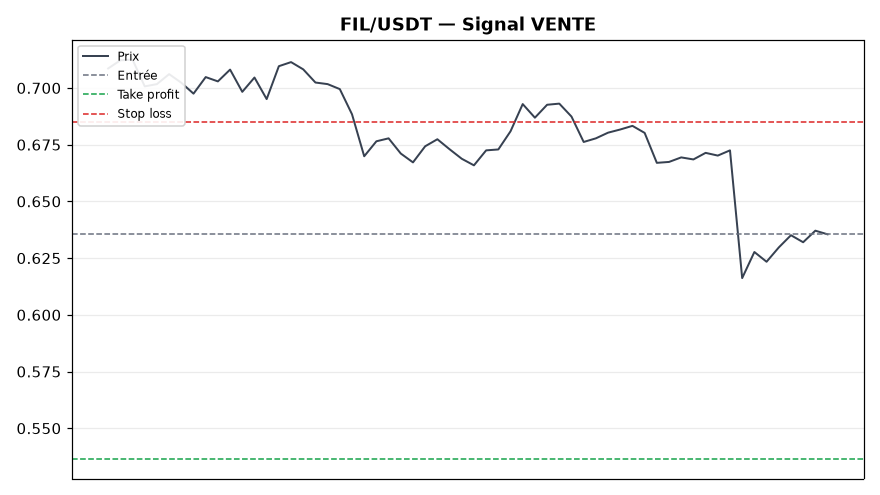
FIL/USDTSELL
Entry0.635500Stop loss0.684921Take profit0.536659
The SELL signal on FIL/USDT was triggered by a bearish crossover: price moved back below its 21-period exponential moving average while the RSI was exiting overbought territory, signaling a possible short-term reversal. Entry around 0.635500, stop loss at 0.684921 (+7.8%), take profit at 0.536659 (-15.6%).
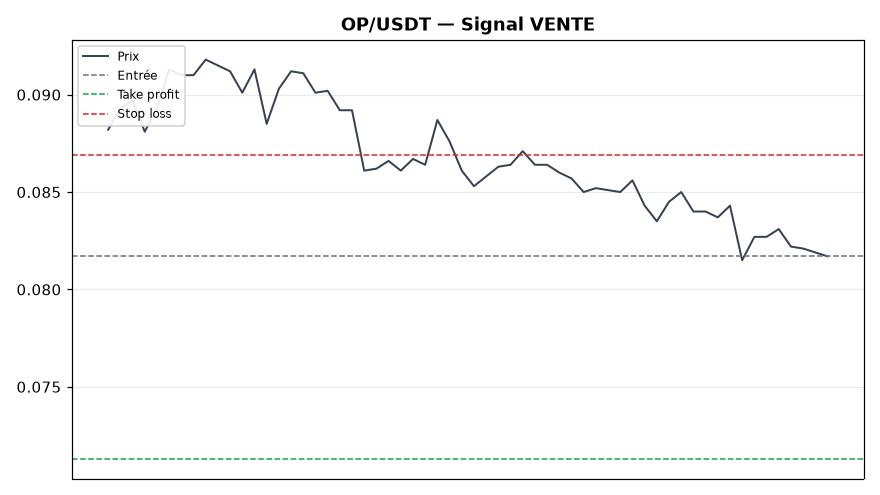
OP/USDTSELL
Entry0.081700Stop loss0.086891Take profit0.071317
OP/USDT confirmed a bearish EMA9/EMA21 crossover with RSI confirmation (exiting overbought), matching the criteria for this SELL signal: entry near 0.081700, stop loss at 0.086891, take profit target at 0.071317.
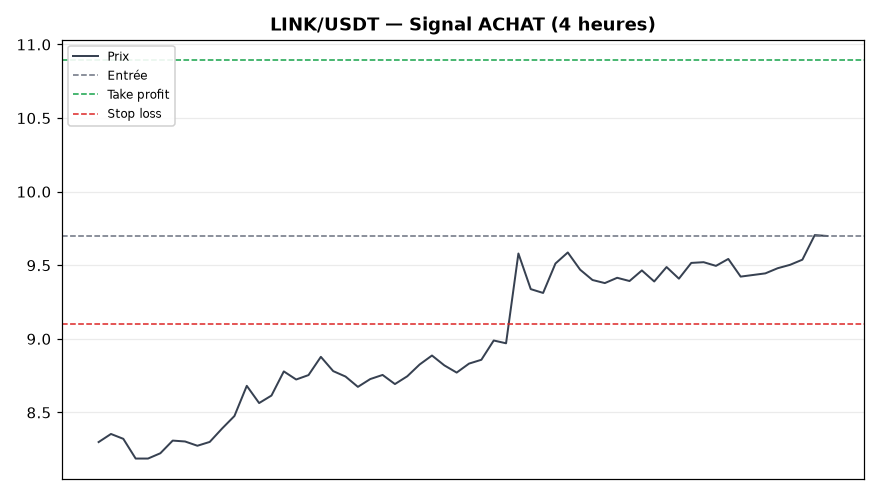
LINK/USDTBUY
Entry9.70Stop loss9.10Take profit10.90
On LINK/USDT, the same ranking principle as relative strength, measured on 4-hour candles: LINK/USDT ranked among the strongest cryptos of the moment. This engine only fires while the market is bearish — the window where the system's other strategies stay silent. Entry near 9.70, stop loss at 9.10 (-6.2%), main target at 10.90 (+12.4%), exit after 3 days. This engine is under observation: its edge measures positive in three years out of four, but declining in the most recent one.
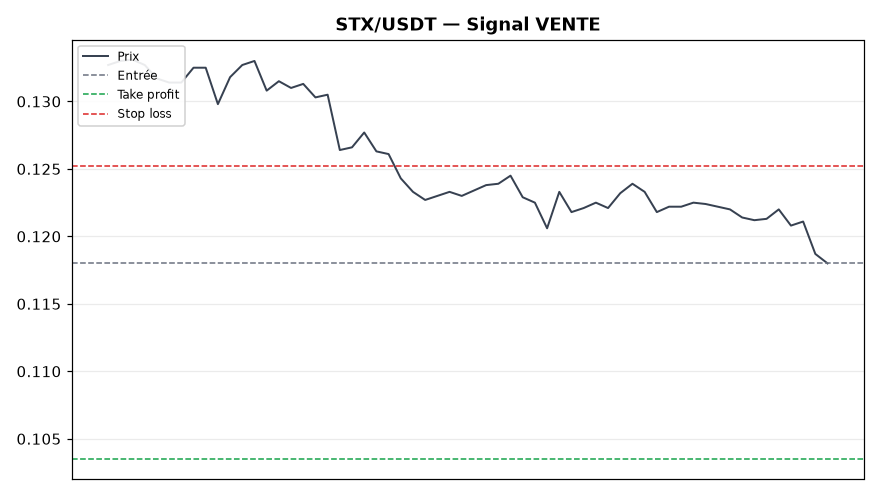
STX/USDTSELL
Entry0.118000Stop loss0.125232Take profit0.103536
The SELL signal on STX/USDT was triggered by a bearish crossover: price moved back below its 21-period exponential moving average while the RSI was exiting overbought territory, signaling a possible short-term reversal. Entry around 0.118000, stop loss at 0.125232 (+6.1%), take profit at 0.103536 (-12.3%).
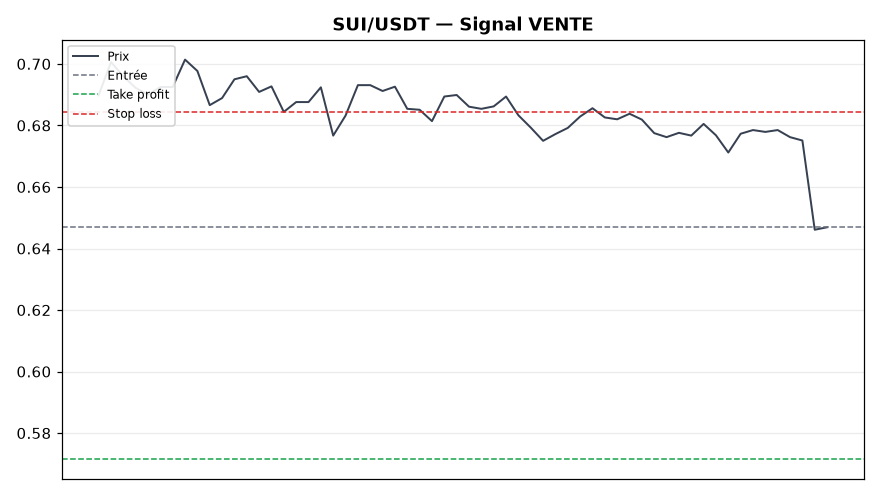
SUI/USDTSELL
Entry0.646900Stop loss0.684489Take profit0.571721
SUI/USDT confirmed a bearish EMA9/EMA21 crossover with RSI confirmation (exiting overbought), matching the criteria for this SELL signal: entry near 0.646900, stop loss at 0.684489, take profit target at 0.571721.
📊 Real performance of past signals
39closed signals
38.5%win rate
15wins
24losses
🔒 9 (23%) secured trades (TP1 reached, break-even or better)
Pair
Type
Result
POL/USDT
BUY
WIN
LINK/USDT
BUY
WIN
ICP/USDT
BUY
WIN
FIL/USDT
SELL
LOSS
APT/USDT
SELL
LOSS
FET/USDT
SELL
LOSS
OP/USDT
SELL
LOSS
STX/USDT
SELL
LOSS
SUI/USDT
SELL
LOSS
SOL/USDT
BUY
WIN
Result determined automatically by comparing each signal's current price to its stop loss and take profit (not a tick-by-tick intrabar analysis).
These results may include signals produced by earlier engines, since switched off. They therefore do not describe the four families above, which have no live track record yet. A carry's outcome is not measured on a price but on the funding actually collected, net of fees.
🧪 The strategy, measured over 6 years
The number that matters is not the strategy's annual return, it is what someone who started on a randomly picked date actually lived through:
After six months: +5.0% median
53% of entries are profitable after six months, and the worst case measured is -61.7%. After three months the median drops to 0.0%, 43% of entries are profitable and the worst case is -49.0%. This is not a product that makes you rich fast: it limits the damage, and it can still hurt.
What the engine does
Every day the 40 tracked pairs are ranked by relative strength — their momentum, measured on daily data. The 12 strongest are bought and held for 7 days. The exit is time-based: positions are not sold on a price target. The stop is deliberately wide, at 4x ATR, because it is disaster protection: it only triggers in 5% of cases.
8.0signals per week while the filter is open
47.7%winning signals
+2.83%expectancy per signal, net of fees
+16.88%average winner, versus -9.24% for a loser
Why the channel sometimes goes quiet for months
No signal is issued while Bitcoin trades below its 200-day moving average. That filter is closed 41% of the time and its longest closure lasted 381 days. Without it the strategy is only positive in 4 years out of 7; with it, it has no losing year over 6 years. In 2022 and in 2026 it simply issued nothing — while holding the same cryptos cost -70.9%, then -39.4%.
What you should know before subscribing
The compounded portfolio shows +83.3% per year over those 6 years, with a maximum drop of -62.9% and no losing year. This is not what a subscriber will earn: that figure assumes going through all six years, from day one.
There is no secret ingredient: this is momentum, nothing more. A plain ranking by past return does just as well.
The trend filter does most of the work. Ranking the pairs only adds about 1.1 point.
This engine went live on 3 August 2026: these figures are measured on historical data, they have not been lived through in real time yet.
Measured over 6 years (2020-2026) on daily data, net of 0.10% round-trip fees, with entry delayed by one day after the signal, on a pair universe free of survivorship bias.
⚠️ Past performance does not guarantee future results. These figures come from simulations on historical data: they are neither a promise nor a guarantee of profit. Trading cryptoassets can cost you part or all of the capital committed.
💼 Live performance (paper portfolio)
If a paper portfolio had allocated 10% of its capital to each of the last 38 resolved signals (sent or not), here is its cumulative track record:
-0.3%
📉 Worst cumulative drop observed (max drawdown): 5.0%
⚠️ Illustrative simulation (fixed position sizing, no compounding of gains) — does not reflect a real account or fees/slippage. Not investment advice.
💬 What people say
👍 « Je trouve le bot vraiment très complet. Les signaux sont de très bonne qualité et le rapport qualité-prix est franchement exceptionnel. Pour le prix, c’est vraiment difficile de trouver mieux. »
✅ Real reviews left via /review by subscribers (anonymized).
❓ The awkward questions
In the order they actually come up, starting with the one we would rather skip.
Are most signals winners?
No, and it is measured: the directional engines are right about half the time, and the median signal loses 0.69%. Profitability comes from a minority of large winners.
The consequence matters: you have to take them all. Cherry-picking the ones that “look solid” statistically means keeping only the losing half.
Why do I get nothing for weeks?
Because the market is falling. The engines that buy strength are cut off while Bitcoin sits below its 200-day average — 41% of the time over six years, and up to 381 consecutive days between December 2021 and January 2023.
Two engines keep working meanwhile: funding carry, which does not bet on price, and 4H momentum. The /marche command recomputes that state live, on demand.
What exactly is a “carry”?
You open two opposite positions of equal size on the same crypto: a spot buy and a short on the perpetual contract. They cancel out — if price rises, one gains what the other loses. Market direction no longer affects you.
What you collect is the funding rate: paid every 8 hours by perpetual buyers to sellers. Measured over six years: 84.2% winning positions. It is not risk-free — the short leg can be liquidated, and the worst measured position lost 19.86%.
How do I know the numbers are not dressed up?
Every signal is published before its outcome is known, then closed publicly, win or lose. The full history is on the transparency page, losses included.
Backtests are measured against a control: a random draw of the same density. A strategy that does not beat that control is dropped — which happened to ten of the twelve approaches tested.
What does it cost, and am I locked in?
The trial is 3 days, free, no card. After that the subscription is paid in crypto, one period at a time: no recurring charge, no auto-renewal. If you do not renew, access simply stops, and there is nothing to cancel.
You will see the real cadence, the shape of the signals, and the days with nothing. It is exactly what a subscriber sees — there is no separate “demo” version of the product.
⚠️ This content is provided for informational and educational purposes only, it does not constitute investment advice. Trading cryptoassets carries a risk of capital loss. Past performance does not guarantee future results.